Daily Market News
Mixed US CPI Data as Core Inflation Falls to 2 Year Lows, DXY Rises and GBP/USD Slides
ThomasTomato
Publish Date: Fri, 13 Oct 2023, 04:19 AM
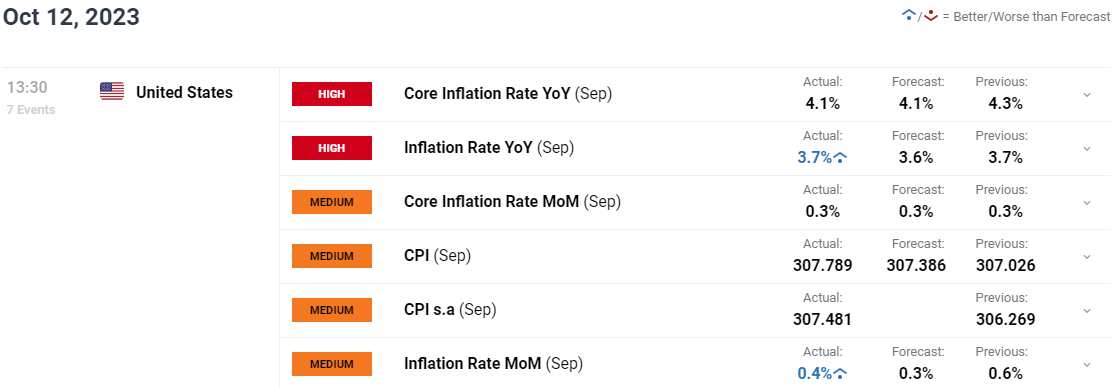
- Core Inflation Rate YoY (SEP) 4.1% Vs 4.1% Forecast.
- Inflation Rate YoY (SEP) 3.7% Vs 3.6% Forecast.
- Inflation Rate MoM 0.4% and Core Inflation Rate MoM 0.3%.
- To Learn More About Price Action, Chart Patterns and Moving Averages, Check out the DailyFX Education Section.
US headline inflation YoY in September held steady at 3.7% in line with estimates while Core CPI YoY hit a 24-month low and dropped from the 4.3% print recorded last month. The Core inflation print is the lowest since September 2021. The MoM CPI print came in above estimates but also fell from the previous print of 0.6%.
Customize and filter live economic data via our DailyFX economic calendar
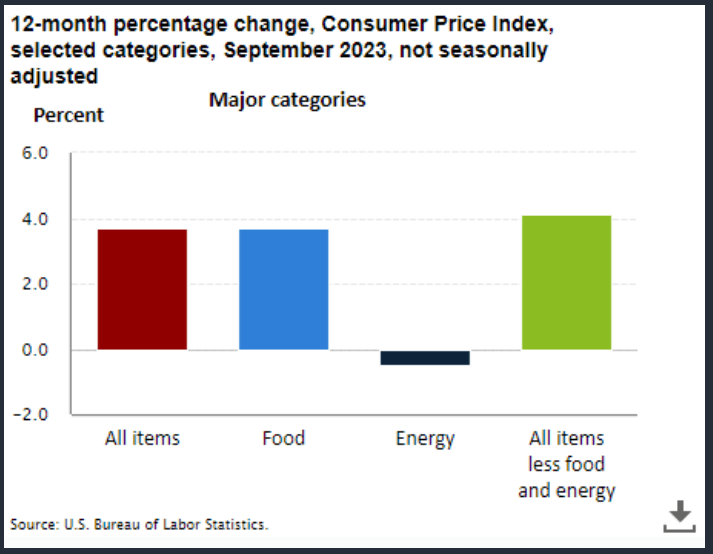
The index for shelter was the largest contributor to the monthly all items increase, accounting for over half of the increase. An increase in the gasoline index was also a major contributor to all items monthly rise. While the major energy component indexes were mixed in September, the energy index rose 1.5 percent over the month.
Source: US Bureau of Labor Statistics
DOVISH FED RHETORIC AND THE OUTLOOK MOVING FORWARD
The US Dollar has come under selling pressure this week on the back of dovish comments from Federal Reserve Officials. PPI data did tick higher yesterday but drilling deeper into the numbers and the increase was not as bad as the print suggested. It is also important to note that PPI does not always have a direct impact on CPI figure and tends to have a lag as well.
Fed Policymaker Rafael Bostic also mentioned yesterday that stalling inflation could be a sign that the Fed need to do more, which makes todays data release all the more intriguing. The rally in risk assets and particularly US equities hint that market participants believe the Fed is most likely done on the rate hike front. This despite an uptick in the two preceding headline inflation prints after the yearly low of 3% achieved in June.
Looking ahead and another uptick in inflation could add some short-term volatility and outlook but is unlikely to have an impact over the medium and longer term as more data will be needed. The data release does justify the Fed rhetoric of higher for longer but does not change the picture for the Fed just yet in terms of tightening further. Demand, labor market dynamics and household savings are likely to determine whether another hike may be needed over the coming weeks. Regarding household savings, Fed Policymaker Collins stated that as household savings continue to dwindle the economy should become more responsive to policy, something we have touched on over the past 6 weeks or so I various articles and videos.
MARKET REACTION
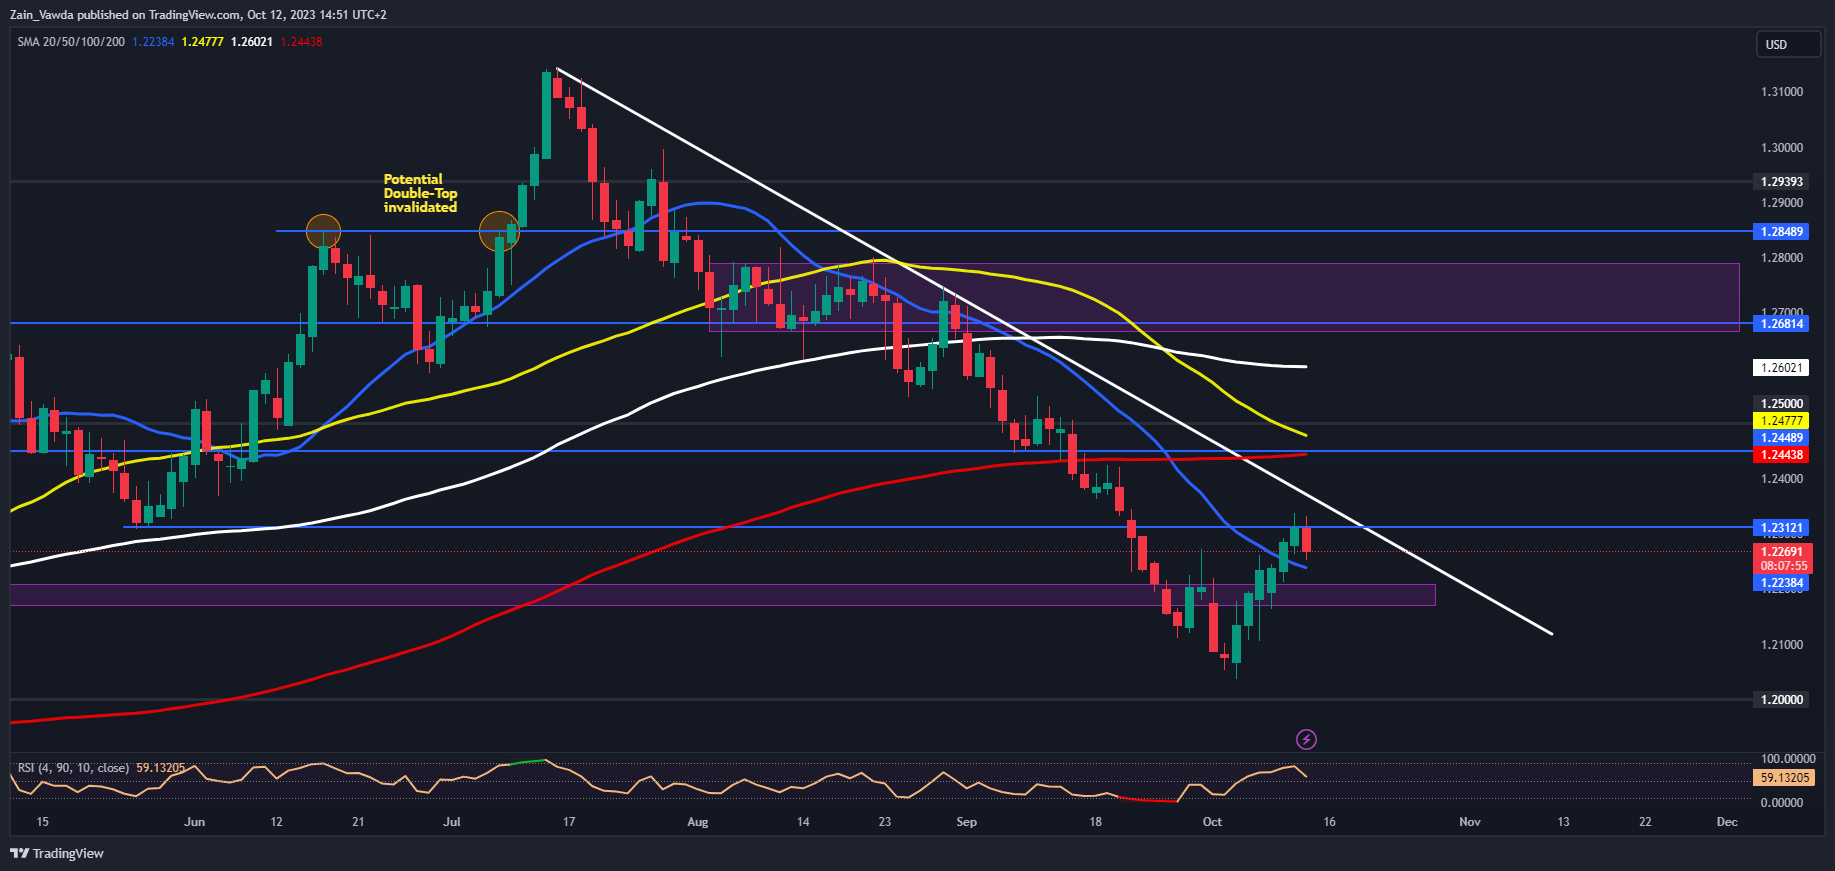
GBPUSD Daily Chart
Source: TradingView, prepared by Zain Vawda
The initial reaction saw GBPUSD Dip about 40 pips and back below the 1.2300 mark as the DXY advanced looking to snap a 6-day losing streak. At present support is being provided by the 20-day MA with a break lower likely to see a return to the 1.2200 mark (pink box on the chart). Should the DXY fail to hold onto gains in the US session we could be in for a retest of the 1.2300 mark and key resistance around the 1.23700 may come into focus.
IG CLIENT SENTIMENT
Taking a quick look at the IG Client Sentiment Data which shows retail traders are 68% net-long on GBPUSD. Given the contrarian view adopted here at DailyFX, is GBPUSD destined to fall back toward the recent lows in the mid 1.20's?
https://www.dailyfx.com/news/mixed-us-cpi-data-as-core-inflation-falls-to-2-year-lows-dxy-rises-and-gbp-usd-slides-20231012.html


