ThomasTomato
Publish Date: Wed, 01 Nov 2023, 10:00 AM
Article by IG Chief Market Analyst Chris Beauchamp
FTSE 100, DAX 40, S&P 500 - Analysis and Charts
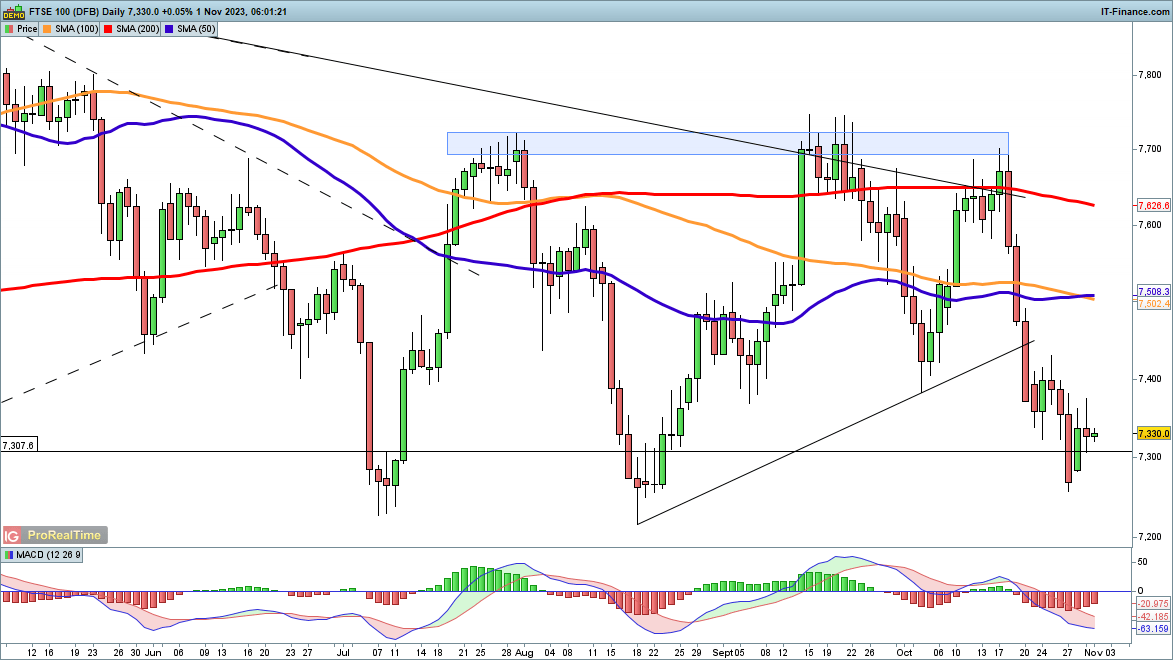
FTSE 100 clings on above 7330
An attempt to continue Monday’s bounce hit some selling yesterday, helped along by the poor reaction to BP’s results. A close above 7350 would be needed to indicate that the buyers have been able to muster fresh strength, and a close above 7400 might then suggest that a low has been formed.
This short-term bullish view would be negated with a close below 7250. This then leaves only the 7200 lows of March and the summer before the index.
FTSE 100 Daily Chart

See Daily and Weekly FTSE Changes in Sentiment
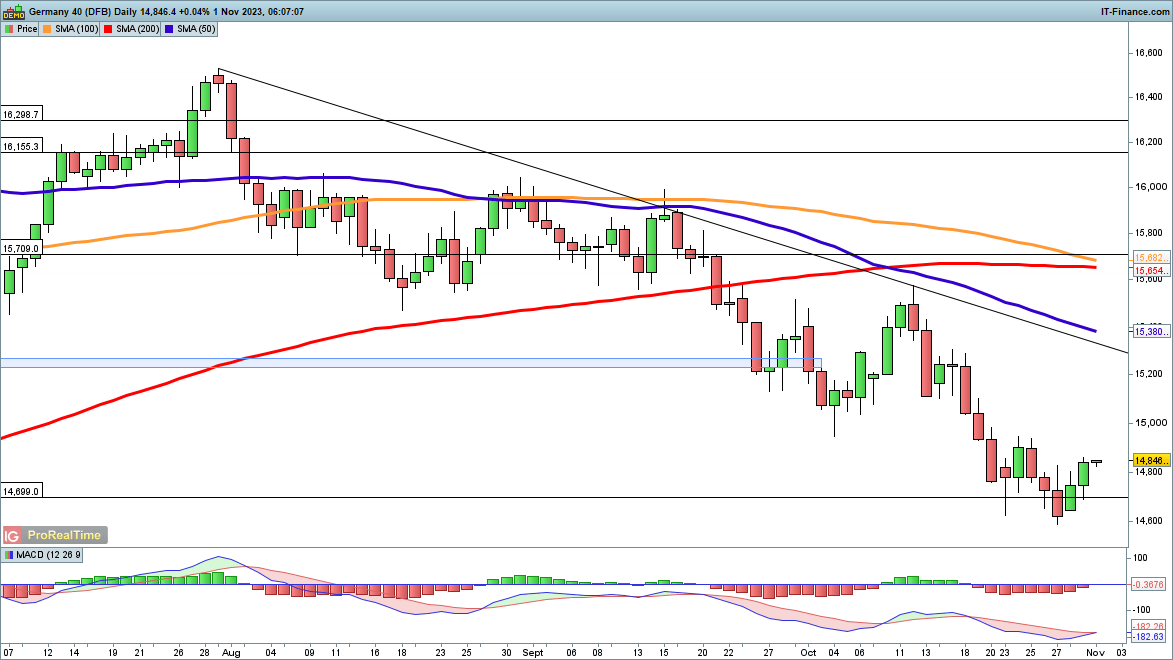
Dax little-changed after two-day bounce
Tuesday saw the index develop further bullish strength, albeit from a lower low.Further gains would target 15,000, and from there, trendline resistance from the August peak would be the next target, in a more extended version of the early August rally.
For the moment a short-term low has been created, and a reversal below 14,600 would be needed to indicate a renewed bearish view.
DAX40 Daily Chart

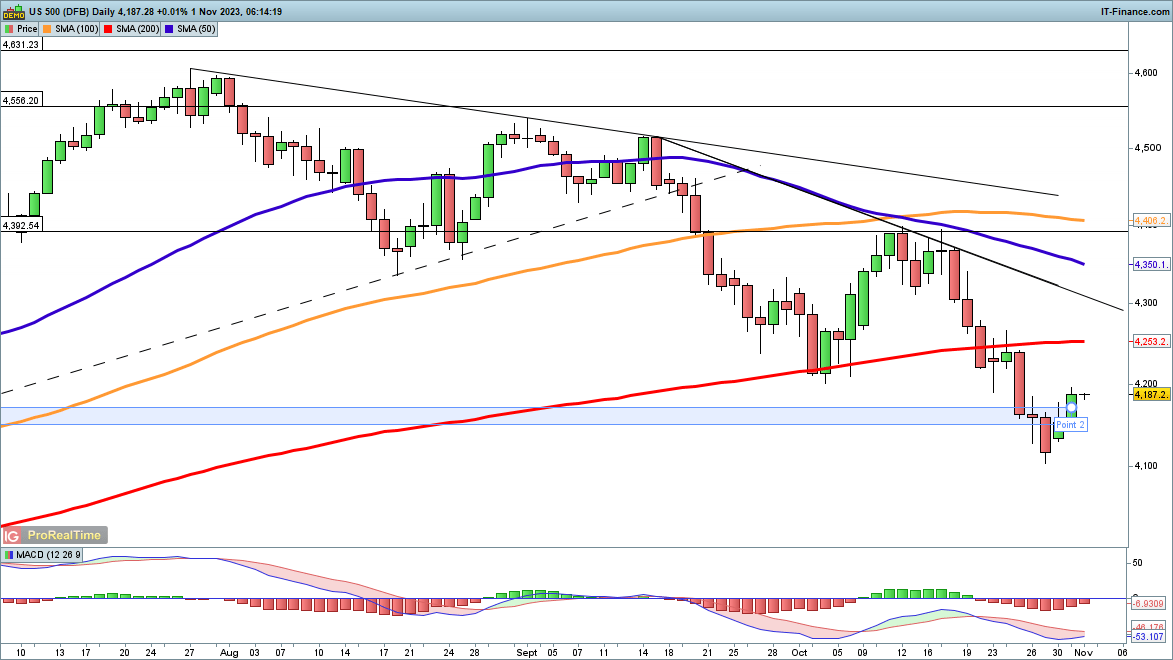
S&P 500 rally slows
Continued gains saw the index move back above its Monday highs, as the price rallied from a lower low. The next target is the 200-day SMA, which acted as resistance in late October. A close above this opens the path to trendline resistance from the September highs, and then on to the 50—day SMA, and then the October peak around 4395.
Sellers will want a reversal back below 4150 to negate this possible bullish view.
S&P 500 Daily Chart

https://www.dailyfx.com/news/ftse-100-edges-higher-while-dax-and-s-p-500-struggle-20231101.html


