ThomasTomato
Publish Date: Tue, 07 Nov 2023, 20:30 PM
AUSTRALIAN DOLLAR PRICE, CHARTS AND ANALYSIS:
- AUD/USD Pullback Setting Up a Potential Long Setup.
- GBP/AUD Faces a Barrage of Resistance Ahead Which Could Halt Further Upside.
- To Learn More About Price Action, Chart Patterns and Moving Averages, Check out the DailyFX Education Section.
Most Read: Bitcoin (BTC/USD) Forecast: Open Interest Surge to Ignite a Fresh Bout of Volatility?
Supercharge your trading prowess with an in-depth analysis of the Australian Dollar outlook, offering insights from both fundamental and technical viewpoints. Claim your free Q4 trading guide now!
AUSTRALIAN DOLLAR FUNDAMENTAL BACKDROP
The Reserve Bank of Australia (RBA) and its new Governor Michele Bullock did not disappoint this morning following repeated comments regarding another rate hike. The Governor issued a warning in her statement that the RBA is prepared to hike rates again if needed as inflationary pressures remain persistent. Bullock commented on the fresh batch of data received since its August meeting “the weight of this information suggests that the risk of inflation remaining higher for longer has increased”.
This rate hike is not one that will be welcomed by consumers as according to estimates it will add another $100AUD to the average $600kAUD mortgage loan. The RBA however, said that inflation while on the way down is taking longer than expected to reach the Central Banks target range of 2-3%.
Australian Inflation

Source: TradingEconomics
The Australian Dollar however, weakened following the announcement. This may in part be down to the recent rally or down to the change in language from the RBA who in October stated “some further tightening of monetary policy may be required”. Today the rhetoric was that the Central Bank remains ready to act if the need arises which was interpreted as slightly dovish in nature.
PRICE ACTION AND POTENTIAL SETUPS
AUDUSD
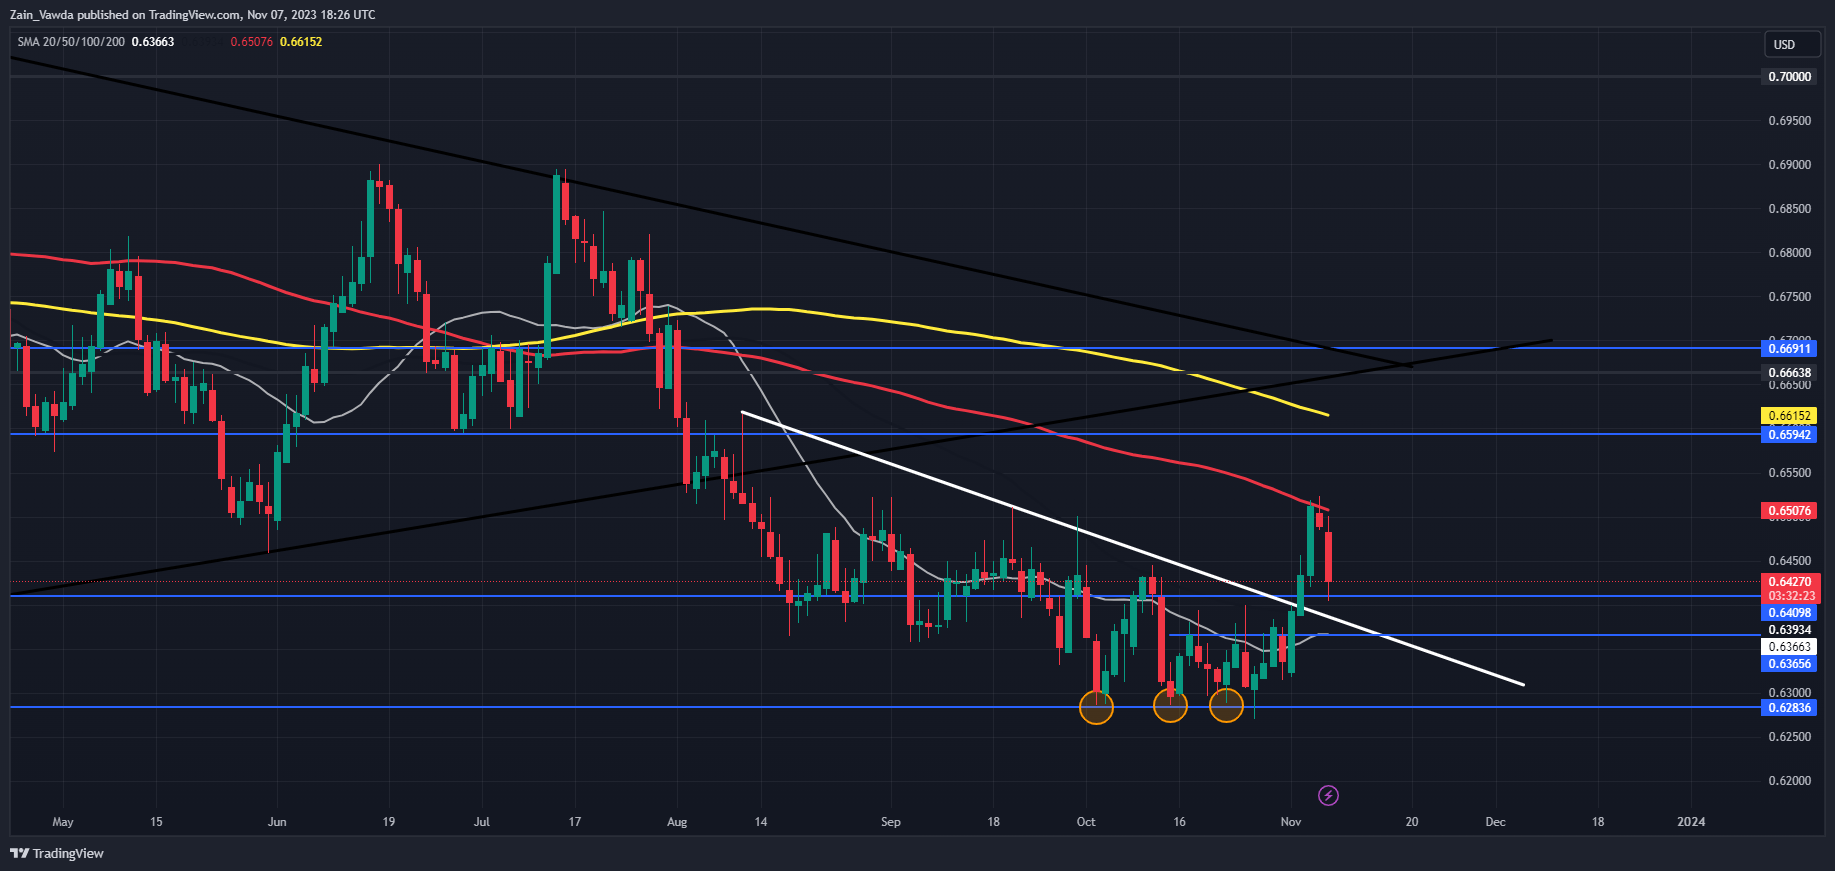
AUDUSD had been on an impressive 3-day rally at the back end of last week before running into resistance at 0.6500 handle where the 100-day MA rests as well. The rally which began following a triple bottom pattern and a descending trendline break gathered pace quickly and could continue from a technical standpoint.
AUDUSD is beginning to look like a textbook long setup with a period of consolidation followed by a trendline break and now it appears we are about to retest the trendline. The ideal scenario here would be a bounce of the trendline and support at either the 0.64098 or the 20-day MA and support area slightly lower at 0.63660 before continuing its move higher.
AUDUSD bulls will be watching the US Dollar index which is attempting a rebound here at the start of the week. In order for Bulls to seize control I think we may need to see a renewed leg to the downside for the DXY which in turn could help AUDUSD cross above the 0.6500 hurdle and beyond.
Key Levels to Keep an Eye On:
Support levels:
- 0.64098
- 0.63660
- 0.62836
Resistance levels:
- 0.65000
- 0.66152
- 0.66911
AUD/USD Daily Chart

Source: TradingView, prepared by Zain Vawda
GBPAUD
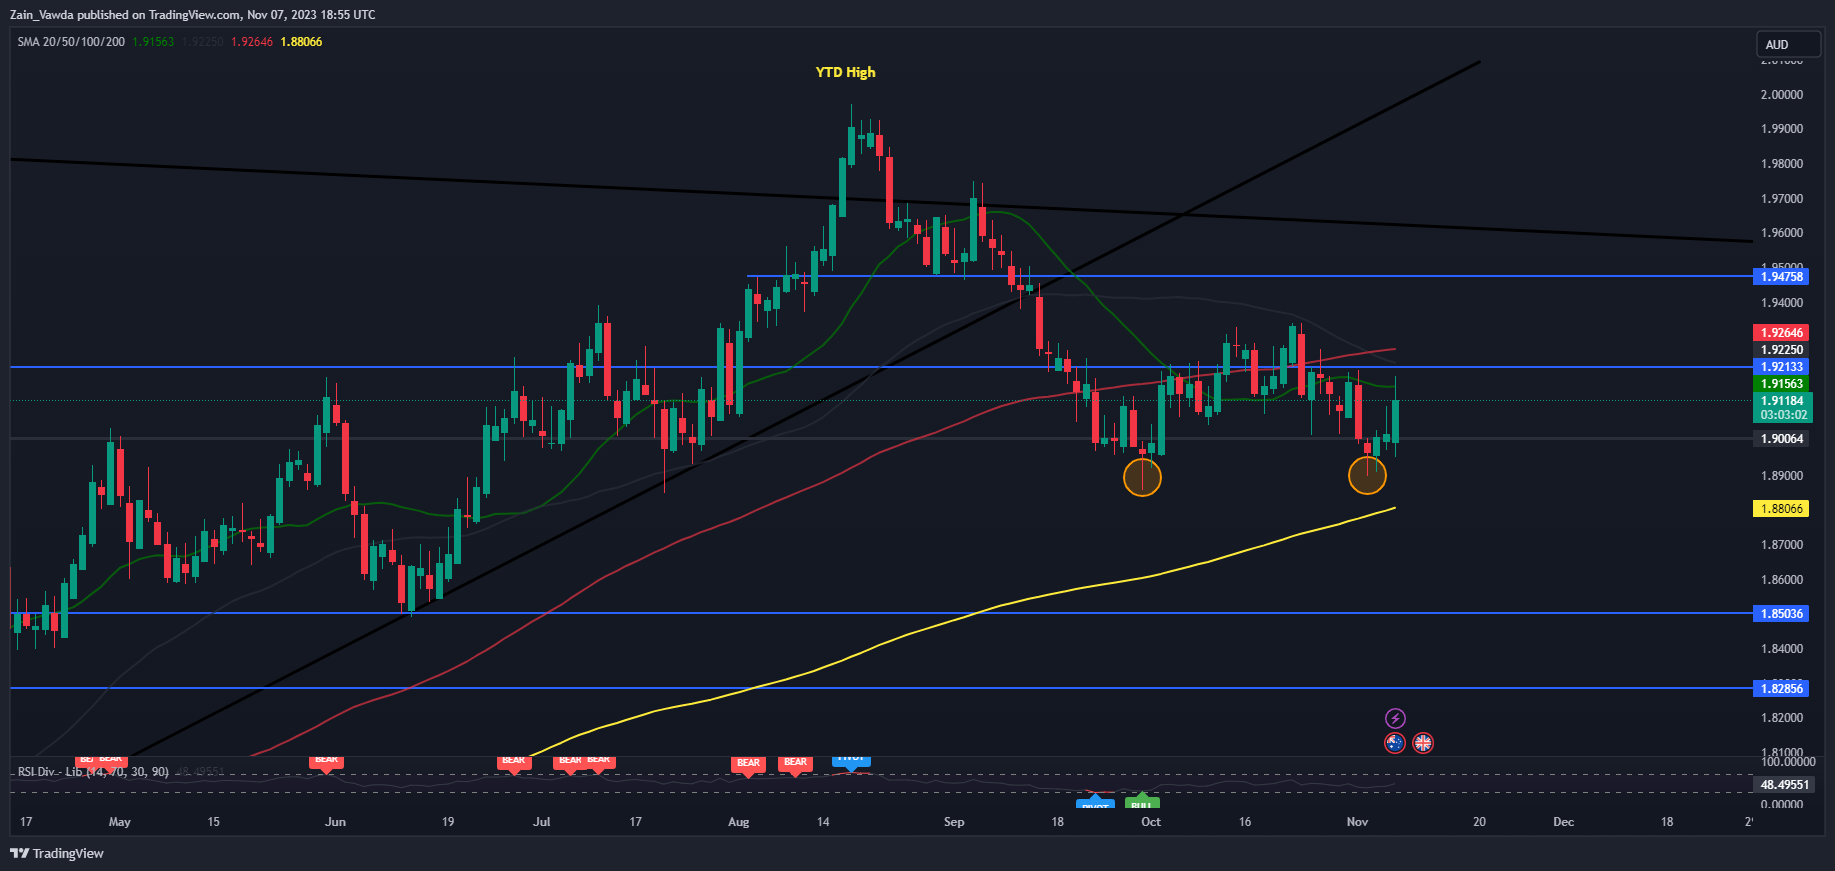
GBPAUD has been ranging now for the better part of 6 weeks. It does appear as if we have printed a double bottom pattern but the upside remains capped by a key area of resistance and the 20,50 and 100-day MA all resting around the 1.92100 area.
Looking at the mixed nature of price action though there is a chance that we could get one more push lower toward support resting at the 200-day MA around 1.8806. This would obviously provide a better risk to reward opportunity for would be bulls looking to get involved.
GBP/AUD Daily Chart

Source: TradingView, prepared by Zain Vawda
https://www.dailyfx.com/news/australian-dollar-price-action-setups-aud-usd-gbp-aud-post-rba-hike-20231107.html


