ThomasTomato
Publish Date: Wed, 10 Jan 2024, 12:00 PM
Article by IG Senior Market Analyst Axel Rudolph
FTSE 100, Nikkei 225, S&P 500, Analysis and Charts
FTSE 100 retreats ahead of US inflation print
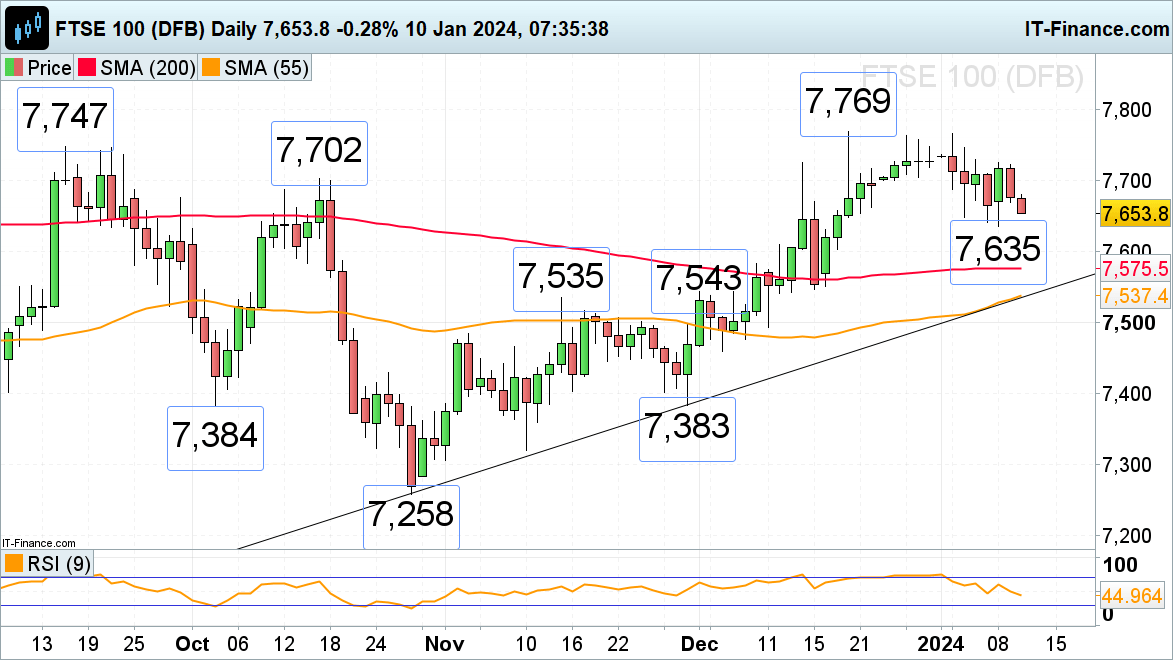
The FTSE 100 has resumed its descent ahead of Thursday’s US CPI and Friday’s UK GDP readings as market participants remain jittery.
Downside pressure should remain in play while Monday’s high at 7,725 isn’t overcome. Above it lies resistance between the September and December highs at 7,747 to 7,769.
A fall through Monday’s 7,635 low would likely push the mid-October low at 7,584 to the fore as well as the 200-day simple moving average (SMA) at 7,575.
FTSE 100 Daily Chart

Nikkei 225 trades in 34 year highs as yen weakens
The Nikkei 225 shot up to levels last traded in January 1990 as slowing inflation in Japan weakened the yen and as the Bank of Japan (BoJ) is expected to stick to its ultra-loose monetary policy for longer.
The psychological 35,000 mark represents the next upside target ahead of the 38,957 December 1989 all-time peak.
Potential slips should find support around the 33,865 to 33,815 late November and December highs.
Nikkei 225 Daily Chart

S&P 500 volatility diminishes ahead of Thursday’s US inflation data
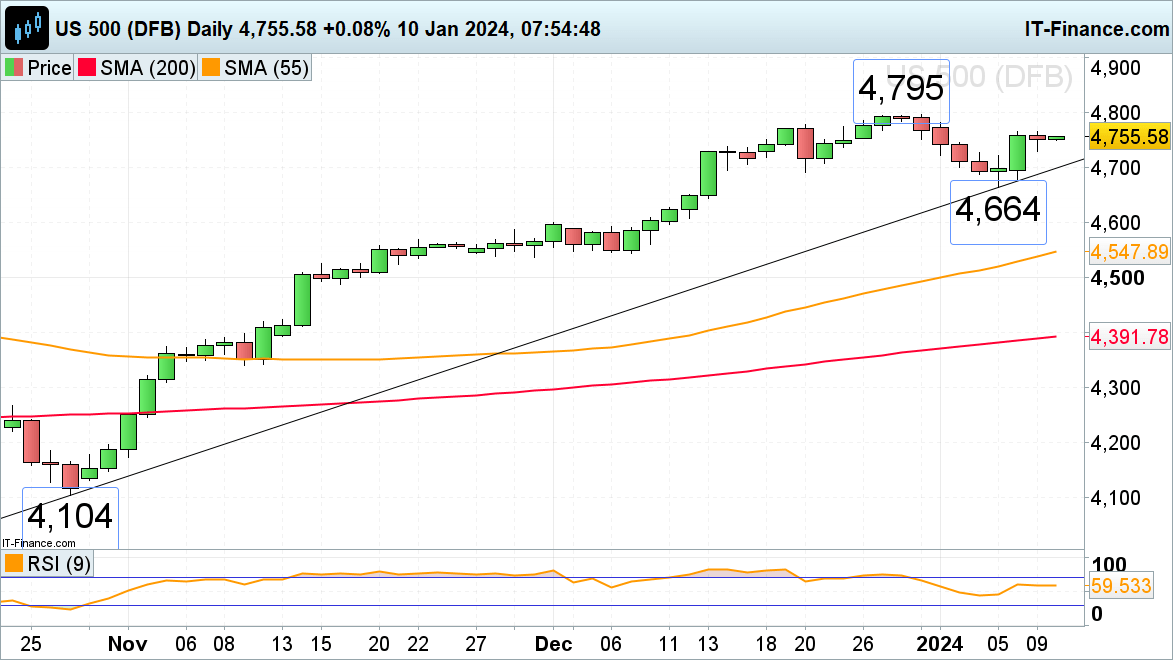
The S&P consolidated on Tuesday, following Monday’s surge higher, ahead of Thursday’s US CPI and Friday’s PPI releases.
A rise above this week’s high at 4,766 would put the 20 December high at 4,778 on the plate. Further up lurks the late December 4,795 peak.
Minor support below Tuesday’s 4,730 low can be spotted along the October-to-January uptrend line and the December 20 low at 4,699 to 4,692 ahead of last Friday’s low at 4,451, made between the November and mid-December 2021 highs at 4,752 to 4,743.
S&P 500 Daily Chart

https://www.dailyfx.com/news/ftse-100-and-s-p-500-on-hold-while-nikkei-225-hits-34-year-high-20240110.html


