ThomasTomato
Publish Date: Thu, 29 Feb 2024, 12:30 PM
Dow drifts down
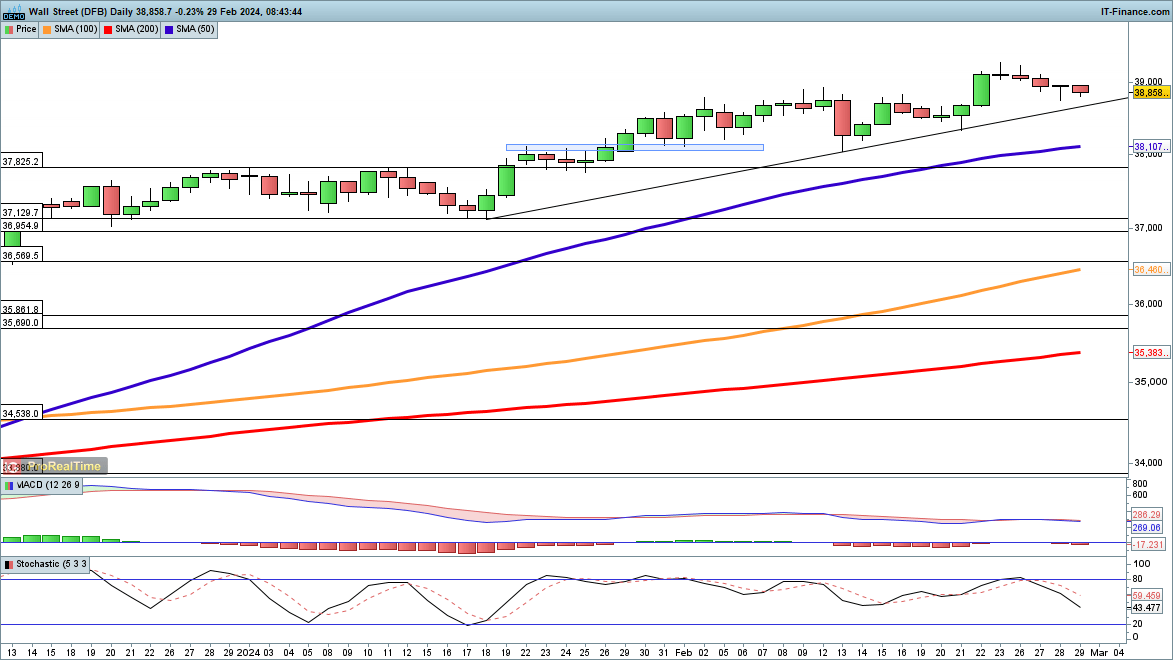
The index continues to edge lower, surrendering some of yesterday’s recovery from the lows.
In the short-term, we may finally see a test of the still-rising 50-day simple moving average, something that has not happened since the rally began in October. Before this the price may find support at the rising trendline from mid-January.
Should this see a bounce develop, then the previous highs at 39,287 come into play, and could clear the way for a test of 40,000.
Dow Daily Chart

Source: IG, ProRealTime - prepared by Chris Beauchamp
There are three main market conditions: Trending, Ranging and Breakout. Learn how to master them all via our comprehensive guide below:
Nasdaq 100 edges down to trendline support
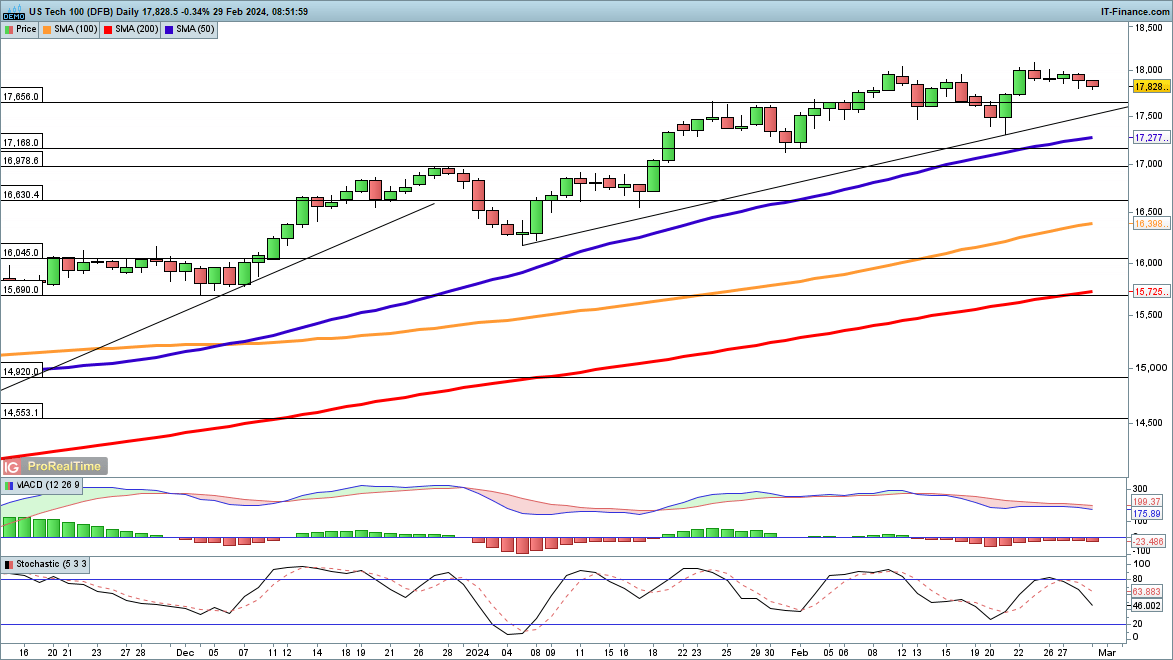
Like the Dow, the Nasdaq 100 is easing back from its recent highs, though the declines here are even more muted.
Potential trendline support from early January comes into play near 17,600, while below this is the 50-day SMA and last week’s low at 17,320.
Daily Nasdaq 100 Chart

Source: IG, ProRealTime - prepared by Chris Beauchamp
Hang Seng under pressure as rally fades
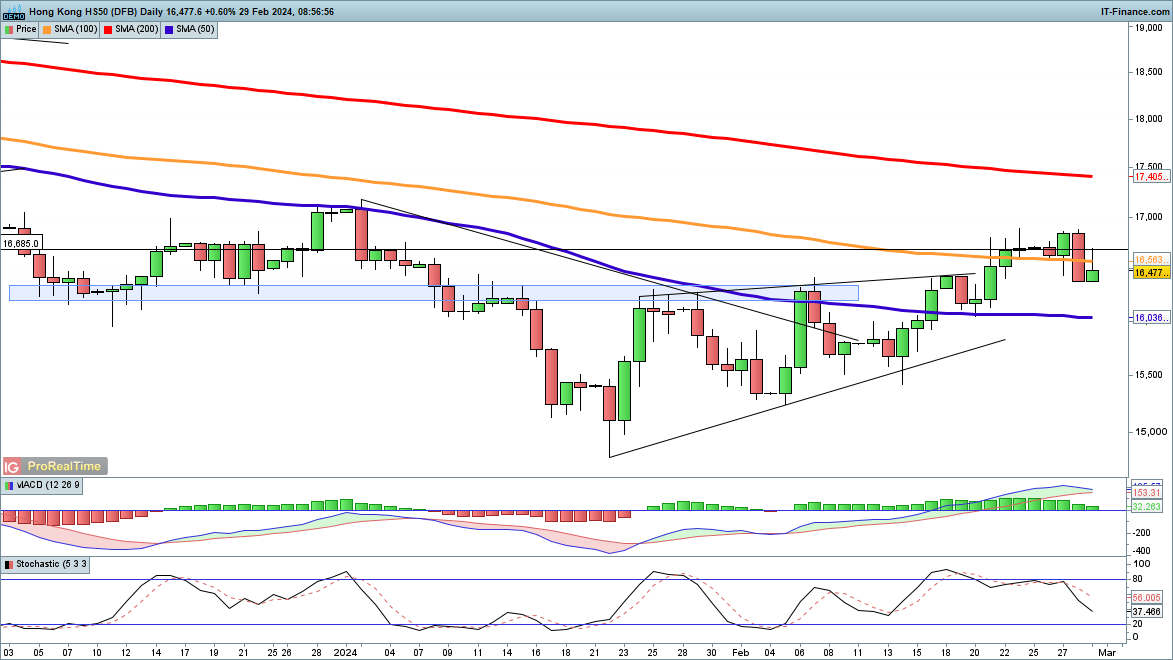
Those waiting for a fresh leg lower in this index’s ongoing downtrend will have been pleased to see the sharp drop on Wednesday that culminated at a close almost at the lows and back below the 100-day SMA.
Further losses below last week’s low at 16,065 would reinforce the bearish view and suggest that the downtrend is back in play, targeting the lows of January at 14,755.
Bulls will want to see a close back above 16,900 to indicate that the index is continuing its counter-trend bounce.
Hang Seng Daily Chart

Source: IG, ProRealTime - prepared by Chris Beauchamp
https://www.dailyfx.com/news/dow-and-nasdaq-100-ease-back-while-hang-seng-bounce-hits-a-wall-20240229.html


