DaNiuTan
Publish Date: Tue, 11 Jul 2023, 03:37 AM
- XAU/USD failed to remove the resistance levels signaling a new sell-off.
- A new lower low activates more declines.
- A valid breakout through the median line (ml) indicates an upside continuation.
The gold price slumped after reaching $1,934, Friday’s high. The metal is trading at $1,921, above today’s low of $1,912. However, it seems to be struggling as the US dollar pulled out of lows.
DXY’s larger rebound should force the XAU/USD to hit new lows. Fundamentally, gold jumped higher after the US data dump on Friday. However, it has failed to confirm a meaningful recovery.
The US reported mixed data in the last session. The NFP figures came in at 209K in June versus 224K expected, and compared to 306K in May, Average Hourly Earnings rose by 0.4%, beating the 0.3% growth, while the Unemployment Rate dropped to 3.6% as expected.
Today, the US will release the Final Wholesale Inventories indicator, which is expected to report a 0.1% drop. The Chinese and Japanese economic data came in worse than expected. Later, the BOE Gov Bailey Speaks could have an impact.
The UK Claimant Count Change, Average Hourly Earnings, Unemployment Rate, Eurozone ZEW Economic Sentiment, and German ZEW Economic Sentiment could move the price tomorrow.
Still, the US inflation figures, RBNZ, and BOC could shake the price on Wednesday. These represent the most important events of the current week.
Gold price technical analysis: Sellers’ dominance

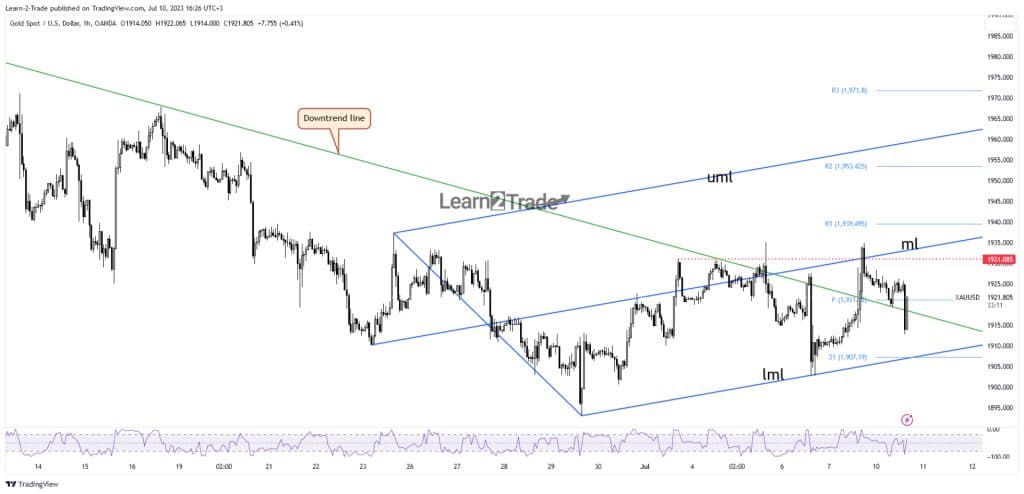
Gold price hourly chart
Technically, the gold price is fighting hard to rebound and recover after today’s massive drop. As you can see on the hourly chart, the XAU/USD found strong resistance right above $1,931 and above the median line (ml) of the ascending pitchfork.
The metal has registered false breakouts again, signaling exhausted buyers and strong downside pressure. The price came back below the downtrend line. However, it remains to see if it stabilizes below it. Staying above the broken downtrend line could announce a new potential rally.
On the other hand, stabilizing under this line should signal more declines. The lower median line (LML) and the weekly S1 (1,907) represent critical downside obstacles.
A valid breakdown through these support levels activates a larger drop. On the contrary, a new higher high and a valid breakout above the median line (ml) can bring new longs and open the door for larger growth.
https://www.forexcrunch.com/gold-price-upside-invalidated-after-rejection-us-cpi-in-focus/


