DaNiuTan
Publish Date: Fri, 17 Nov 2023, 10:44 AM
- The bias is bullish as the USD depreciates versus its rivals.
- Taking out the 150% line activates more gains ahead.
- Only a bearish pattern could signal a new sell-off.
The gold price continued its upward trend, buoyed by the Dollar Index’s recent decline. The depreciation of the USD has provided impetus for XAU/USD buyers to drive prices higher.
–Are you interested to learn more about MT5 brokers? Check our detailed guide-
The yellow metal achieved new highs following the release of disappointing economic data in the last trading session. Notably, the US Industrial Production reported a 0.6% decrease, surpassing the anticipated 0.4% growth.
Additionally, the Capacity Utilization Rate declined to 78.9% from 79.5%, and Unemployment Claims surged to 231K, well above the expected 221K.
Today brought further developments as UK Retail Sales disappointed with a 0.3% drop, falling short of the anticipated 0.5% growth. In contrast, Eurozone Final CPI and Final Core CPI met expectations, while Current Account exceeded them.
Looking ahead, Canada is set to release RMPI, IPPI, and Foreign Securities Purchases. However, the spotlight remains on US data, with Building Permits expected at 1.45M compared to the forecasted 1.47M, and Housing Starts potentially dropping to 1.35M from 1.36M.
It’s worth noting that better-than-expected data may exert downward pressure on XAU/USD after its robust rally.
Gold price technical analysis:

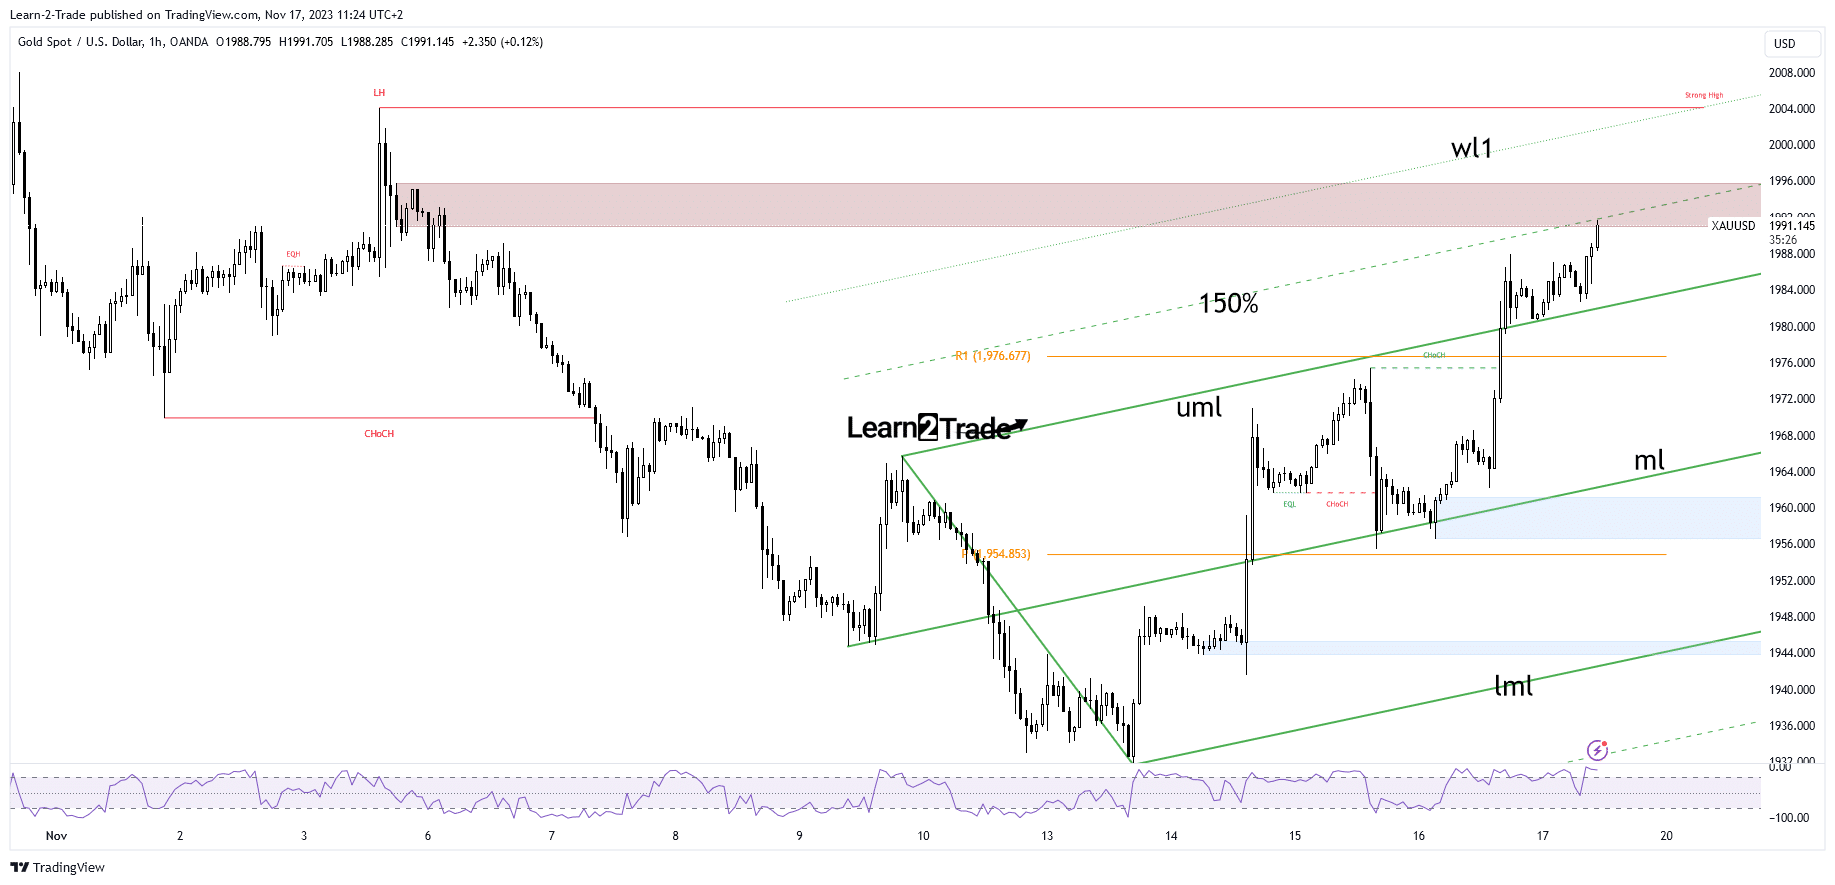
From a technical standpoint, the XAU/USD has demonstrated accelerated growth subsequent to a successful retest of the median line (ml) and the breach of the upper median line (uml). Currently positioned within a demand zone, it confronts the 150% Fibonacci line, serving as a dynamic resistance. A breakthrough of this upward barrier, coupled with the negation of the supply zone, signals the potential for further upward momentum.
–Are you interested to learn more about Thailand forex brokers? Check our detailed guide-
The warning line (wl1) stands out as a noteworthy upside target should the current rate of growth persist. Conversely, a false breakout beyond the 150% Fibonacci line, accompanied by the formation of a robust bearish pattern within the supply zone, could herald a new sell-off. As such, vigilant monitoring of these key technical indicators is advised to comprehensively understand potential market movements.
https://www.forexcrunch.com/gold-price-near-2000-as-greenback-stays-red-after-cpi/


