DaNiuTan
Publish Date: Sat, 13 Jan 2024, 18:55 PM
- US consumer inflation data came in higher than expected.
- There was a slight improvement in the GDP numbers in the UK.
- Capital Economics projected a potential drop in British inflation to 1.7% in April.
The GBP/USD weekly forecast shows a hint of bearish sentiment as the persistence of US consumer inflation suggests the potential for an extended era of high interest rates in the US.
–Are you interested to learn more about forex options trading? Check our detailed guide-
Ups and downs of GBP/USD
The pound had a choppy week as investors absorbed US and UK data. On Thursday, US consumer inflation data came in higher than expected, leading to a slight adjustment in Fed rate cut bets. However, this changed soon after when the producer price index revealed easing inflation.
Meanwhile, in the UK, there was a slight improvement in the GDP numbers. However, the outlook for the economy remains poor.
Next week’s key events for GBP/USD
Investors expect key releases from the UK, including employment, inflation, and retail sales. Meanwhile, the US will release data on retail sales. Investors will focus on the UK inflation report, which might show a drop to 3.8%. On Friday, Capital Economics predicted that Britain might experience a slowdown in its price growth to under 2% before the US and the Eurozone.
Moreover, the consultancy projected a potential drop in British inflation to 1.7% in April while anticipating 2.0% in the eurozone and 2.6% in the US during the same period. Consequently, investors speculate on the possibility of a BoE rate cut as early as May.
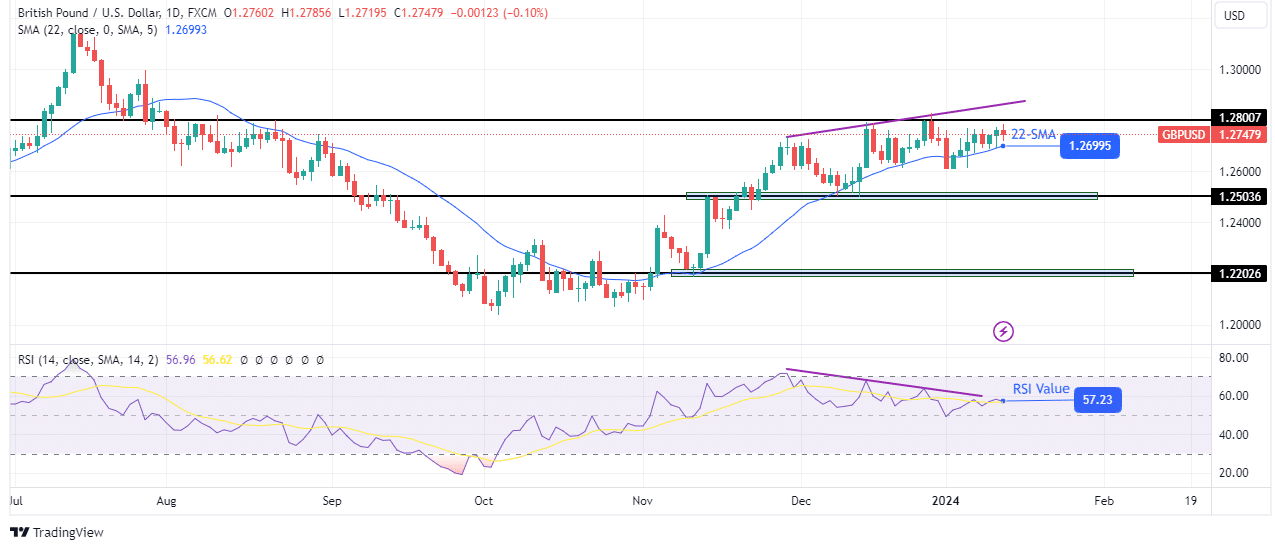
GBP/USD weekly technical forecast: Bullish rally stalls at 1.2800

The charts show that GBP/USD has risen to the 1.2800 resistance level, where the bullish trend has slowed. This trend started strong when buyers took control near the 1.2202 key level. However, it weakened as the price approached the 1.2800 key resistance level. The price is trading closer to the SMA. Additionally, bears have started making attempts to break below the 22-SMA. However, the main indicator of bullish weakness is the RSI, which has made a bearish divergence. As bullish momentum weakens, bears get a chance to take control.
–Are you interested to learn about forex robots? Check our detailed guide-
Therefore, if this continues next week, bears will likely break below the 22-SMA to retest the 1.2503 support level. A break below this level would confirm a new bearish trend, as the price would start making lower lows and highs.
https://www.forexcrunch.com/blog/2024/01/13/gbp-usd-weekly-forecast-fed-hawks-to-retain-selling-pressure/


