symbol_logo_tpl
symbol_tpl
price_tpl (change_perc_tpl%)
Home
Market
Live Quotes
Economic Calendar
News & Blogs
Daily Trading Signals
Alert
Brokers
Compare
Widgets
English
简体中文
繁體中文
Login
Sign Up
Home
Market
Live Quotes
Economic Calendar
News & Blogs
Daily Trading Signals
Alert
Brokers
Compare
Widgets
English
简体中文
繁體中文
Login
Sign Up
Login
Sign Up
English
简体中文
繁體中文
Groups
Events
Widgets
Daily Trading Signals
Economic Calendar
Alert
x
Warning!
Home
Charts
News & Blogs
Events
Brokers
Top Brokers
name_tpl
minionbanana
Joined since 09-06-2023
Follow
Just a minion that loves bananananana
Followers
6
Following
1
Copiers
0
Blog Posts
1
Overview
Blogs
Following
Followers
Liked
Commented
All Feed
All
Blogs
News
Add to your post
Photos/Videos
Add Photos/Videos
Edit
Add Photos/Videos
Edit
Add Photos/Videos
Delete All
Cancel
Save
Edit Photos/Videos
Cancel
Done
name_tpl
follower_tpl
symbol_logo_tpl
symbol_tpl
name_tpl
author_tpl
header_desc_tpl
author_tpl
time_tpl
Follow
View All News
Edit post
Delete post
Report post
Follow
post_content_tpl post_trade_div_tpl
like_count_tpl
like_count_text_tpl
like_tooltip_tpl
comment_count_tpl
comment_count_text_tpl
comment_tooltip_tpl
share_count_tpl
share_count_text_tpl
share_tooltip_tpl
View more comments
user_comment_new_tpl
content_tpl
content_ori_tpl
Previous
Next
blog_name_tpl
blog_title_tpl
logo_tpl
blog_desc_tpl
name_tpl
logo_tpl
content_tpl
logo_tpl
trade_code_tpl
trade_name_tpl
trade_price_tpl
trade_chg_tpl%
Cancel
content_tpl
content_ori_tpl
author_tpl
time_tpl
post_content_tpl
Edit
Delete
No feed available
No content available
No comment available
Sorry, this content is not available at the moment.
This content may have been deleted or only accessible to audience that you are not in.
Share
×
WhatsApp
Facebook
Twitter
Linkedin
Telegram
COPY TO CLIPBOARD
Suggested For You
fn_tpl
follower_tpl
status_tpl
Blogs
View All
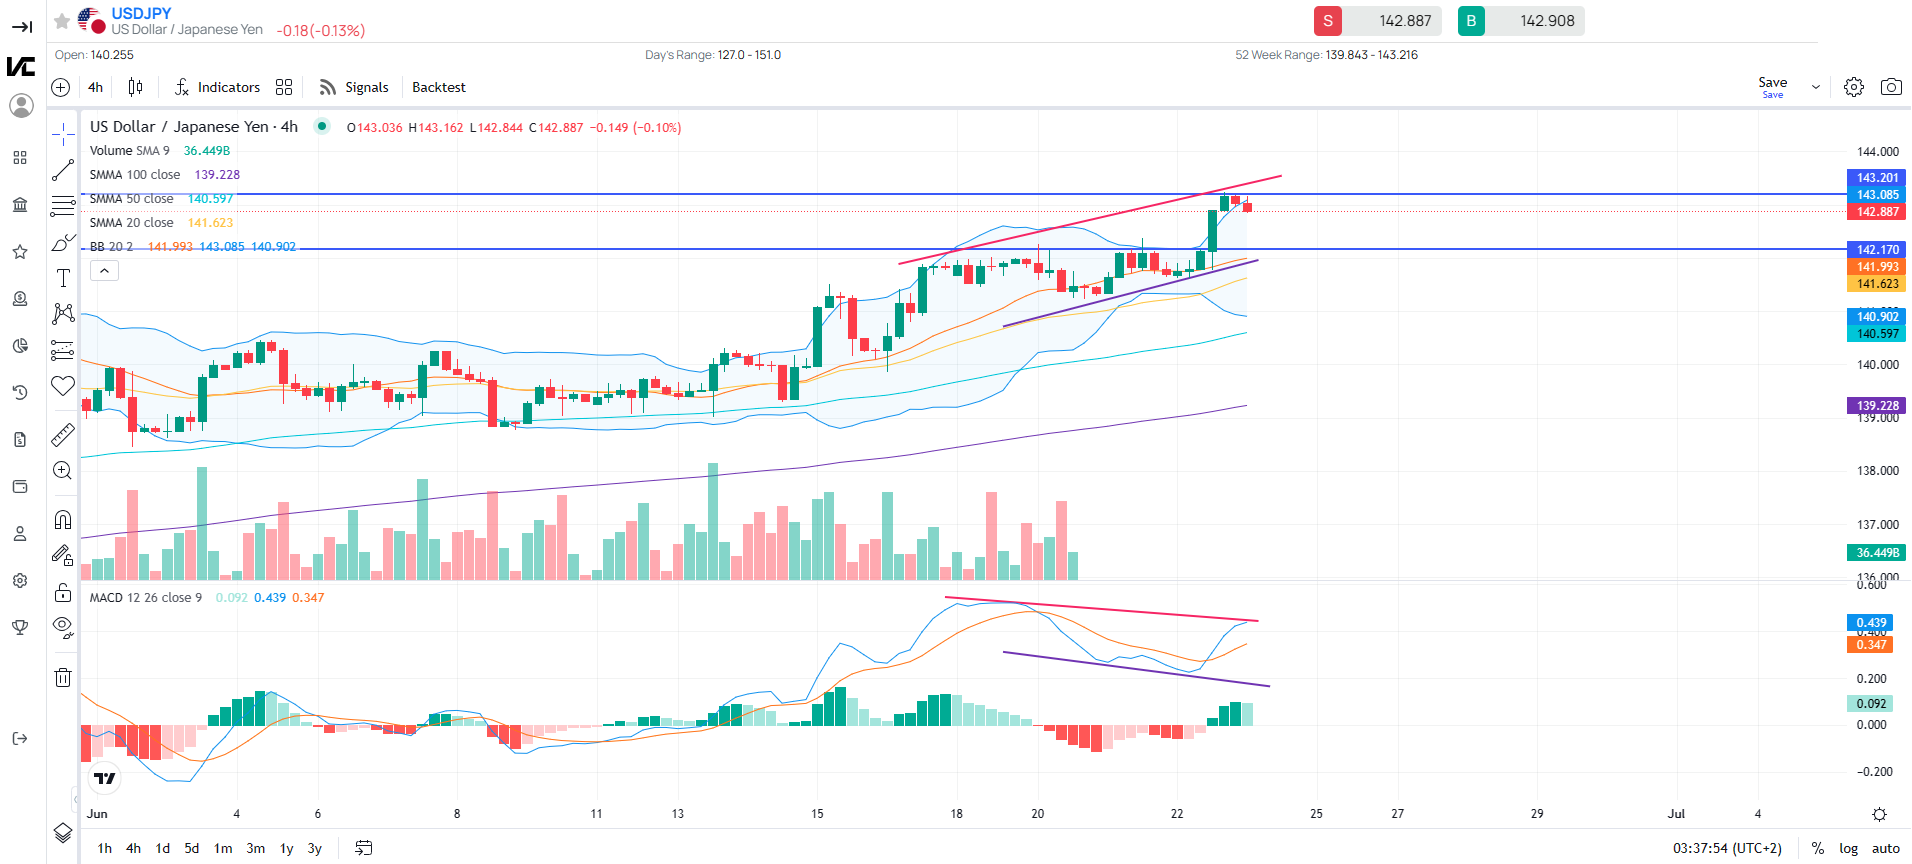
Technical analysis on CFDs
USD/JPY - Upward momentum reduced, short-term correction likely
Top
Alert Message
x
0%
Close
Confirm Message
x
Cancel
Confirm
Confirm Message
x
Cancel
No
Yes